Decision Tree of Text Data in Python
Link to Code
Link to Data Set
WordCloud
Decision Trees
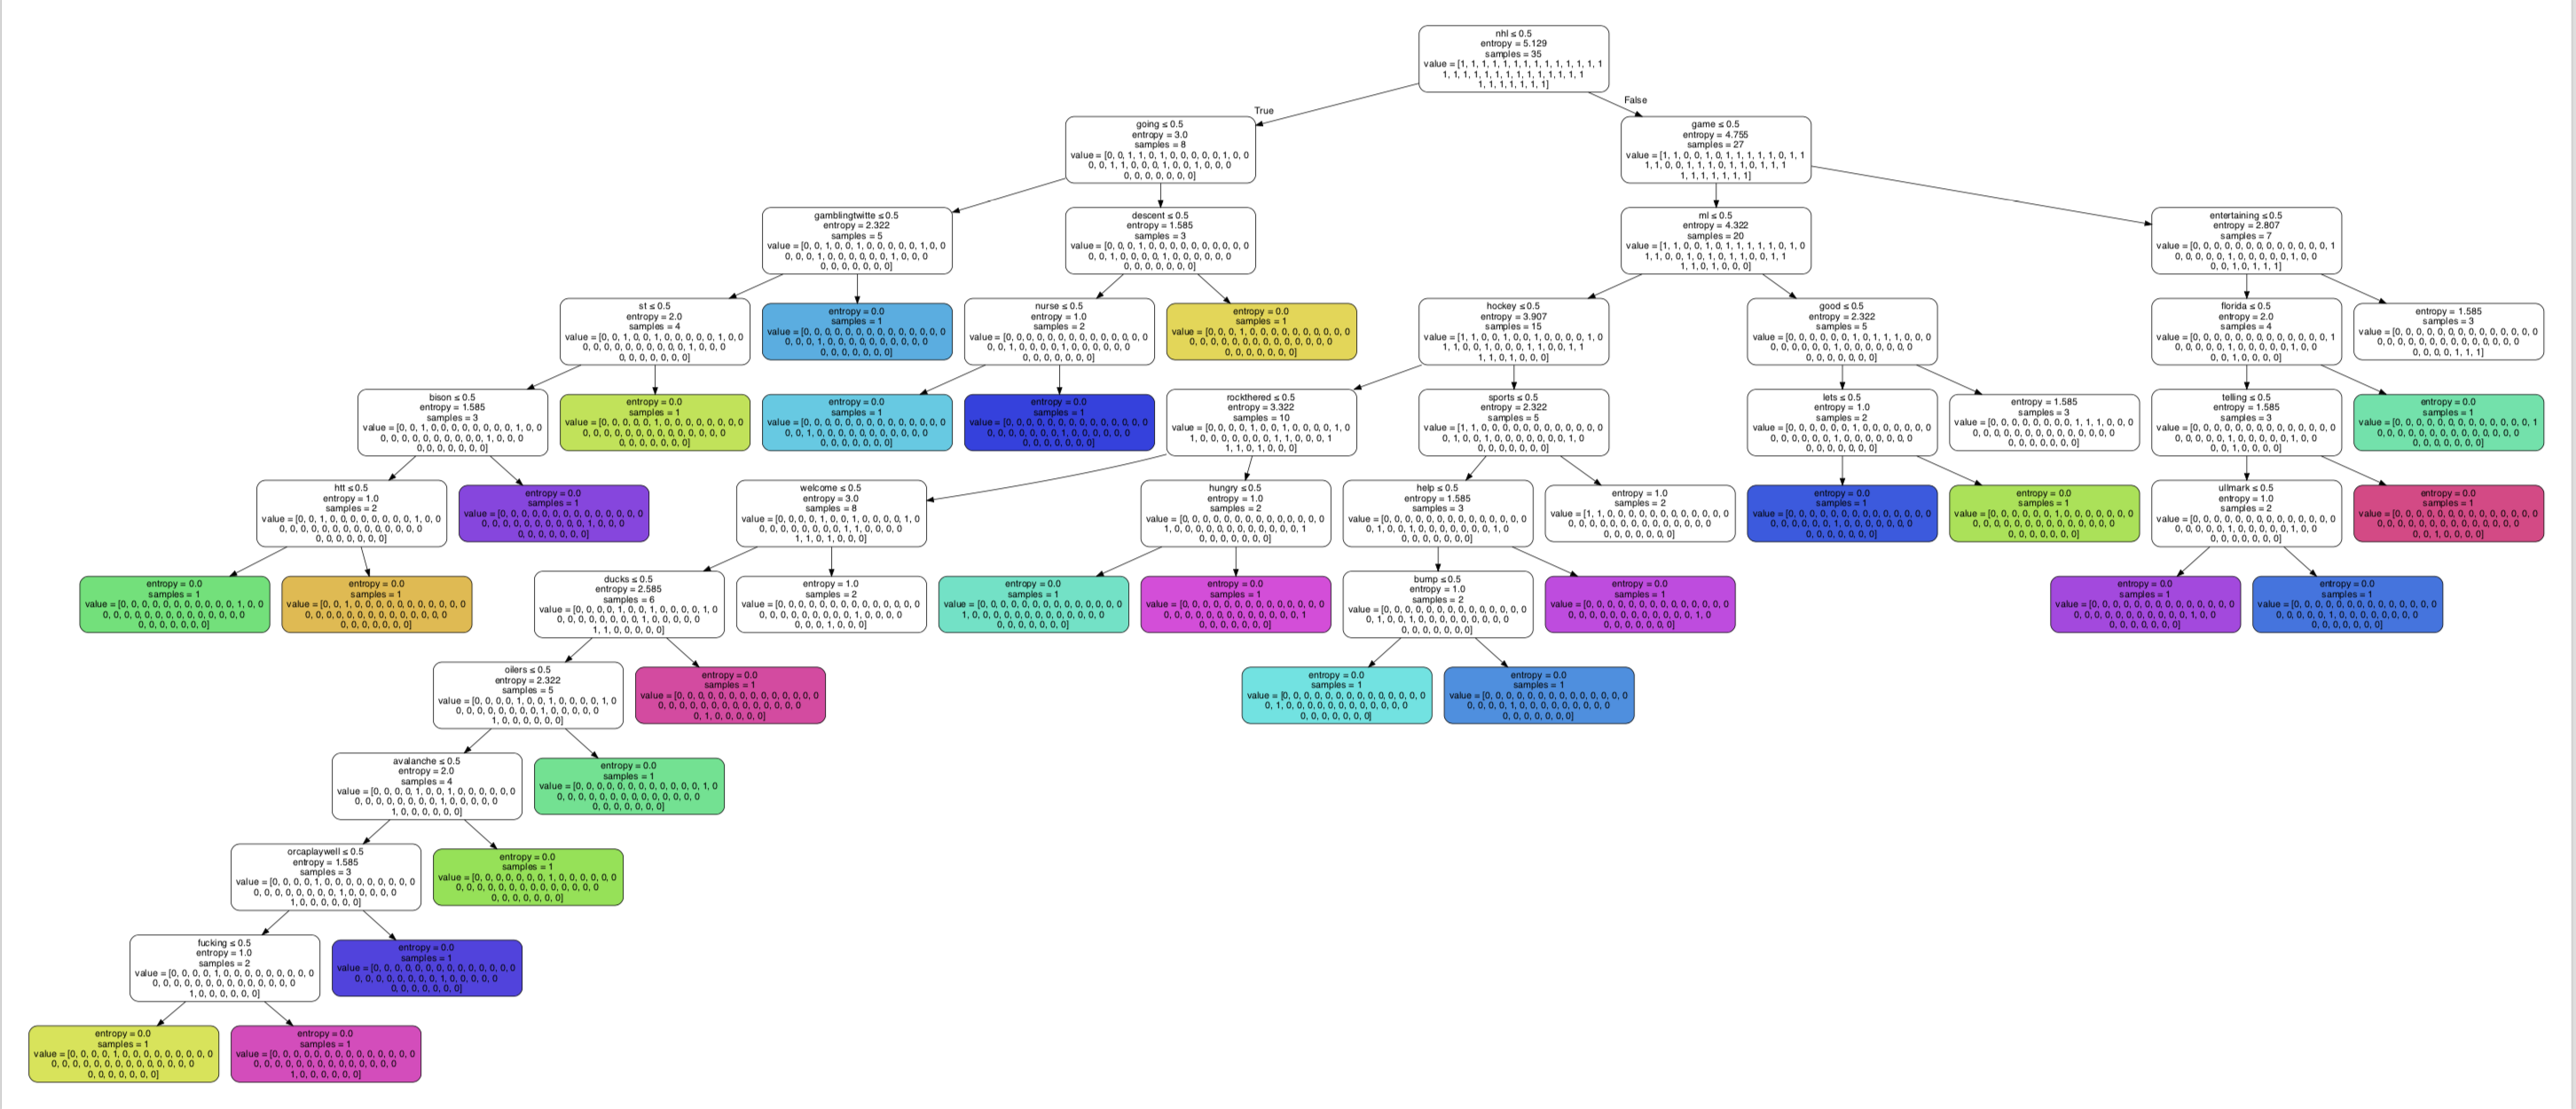
Figure 1. Decision Tree 1 This tree has a root node of nhl where it splits into two directions. In one direction it is focused on the game of hockey itself while the ther branch discusses has words that are about watching the game The tree shows the entropy of each node with the root node not being pure. Additionallly, it was split using best which splits it by the feature with the highest importance.Furthermore the some splits made sense such as oilers, ducks and avalanche because they are all NHL teams and hockey to sports becuase hockey is a sport. Click on the image to see the pdf file of the image.
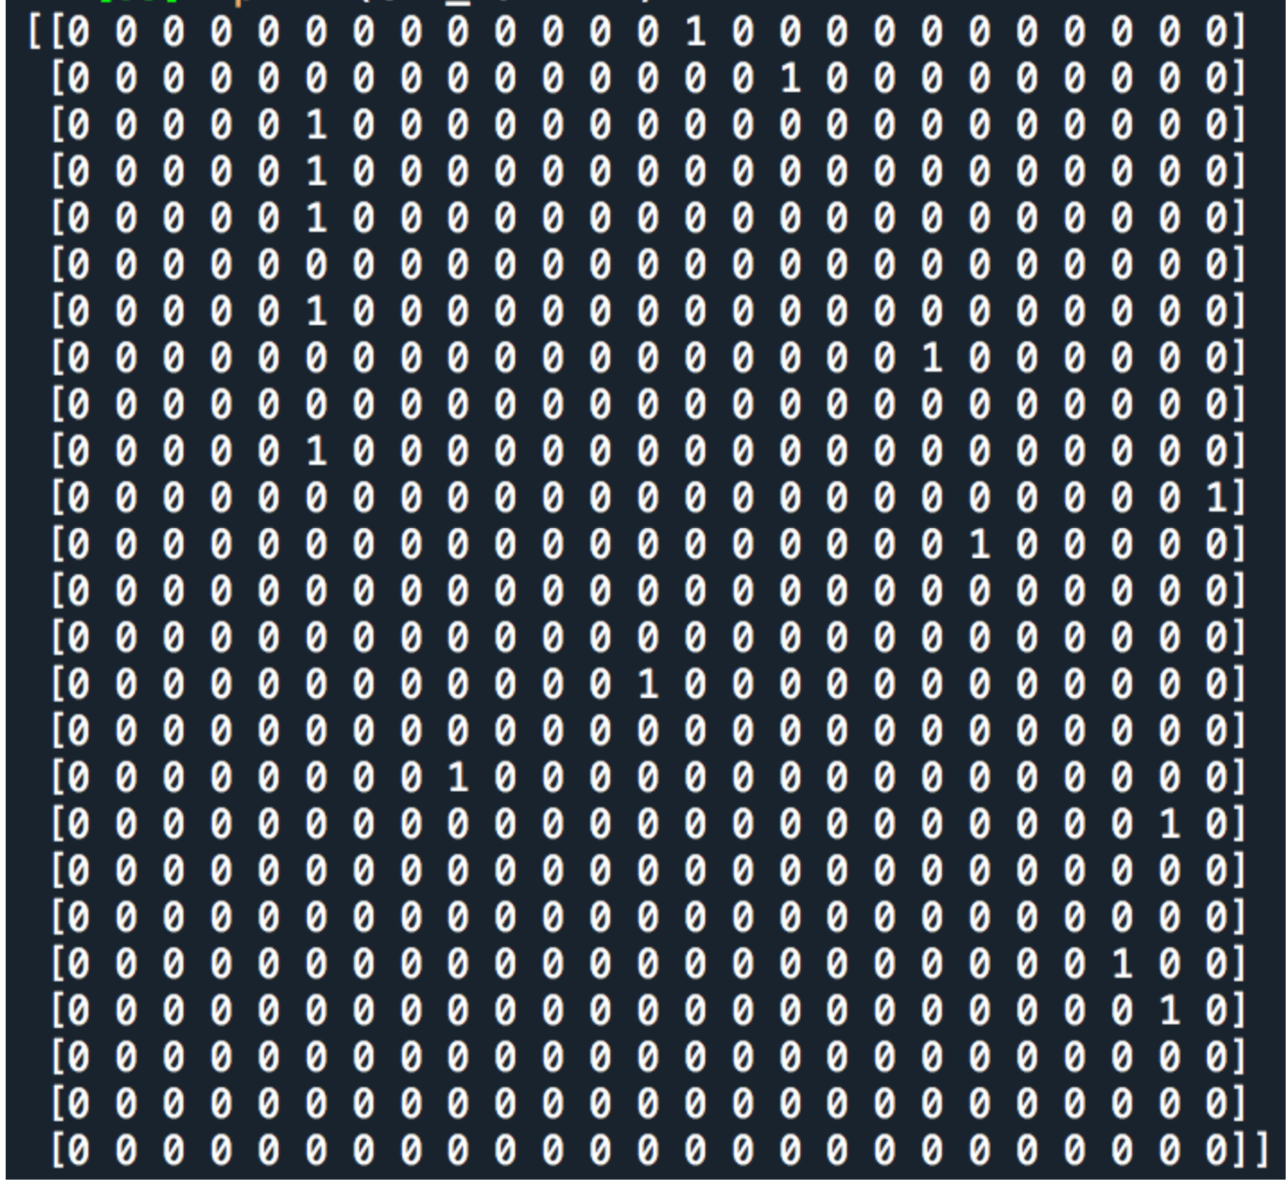
Table 1. Confusion Matrix of Decision Tree 1 A confusion matrix was created for decision tree one with a 0% accuracy. The results show that it was not effective most likely due to the random nature of tweets.
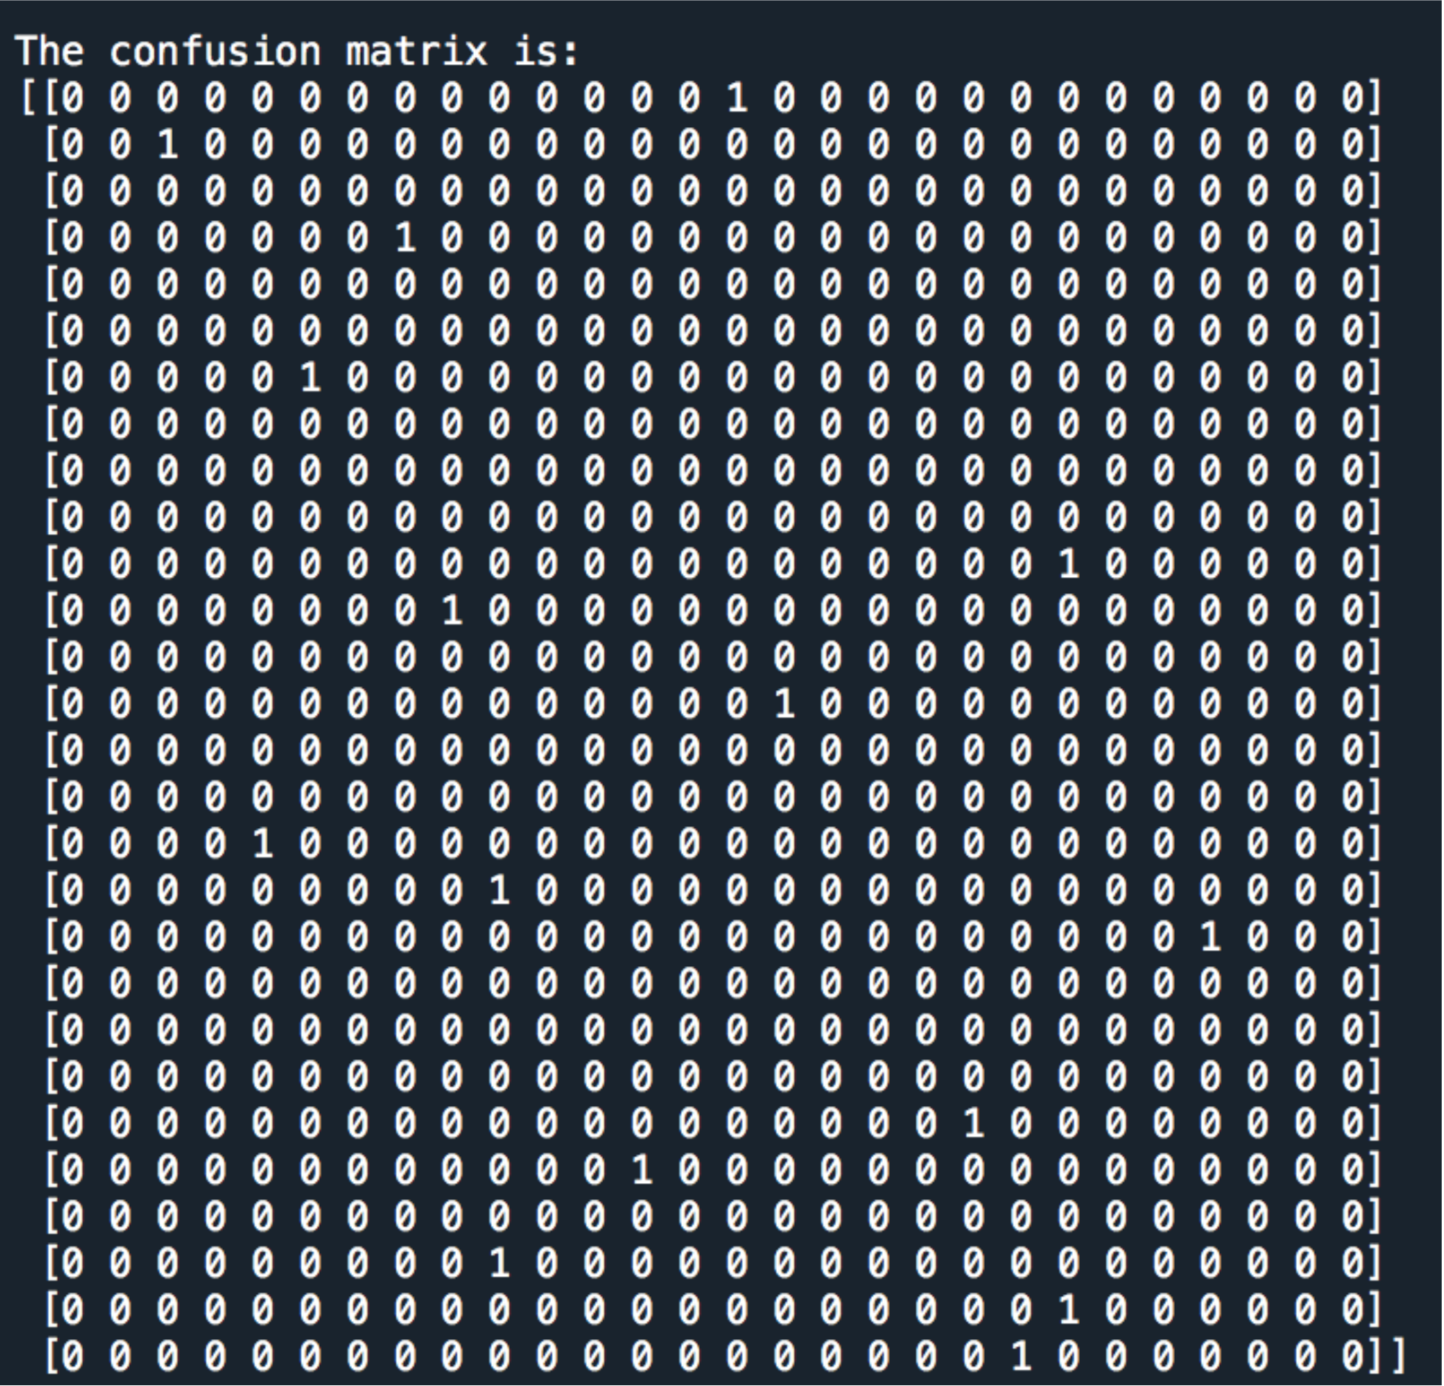
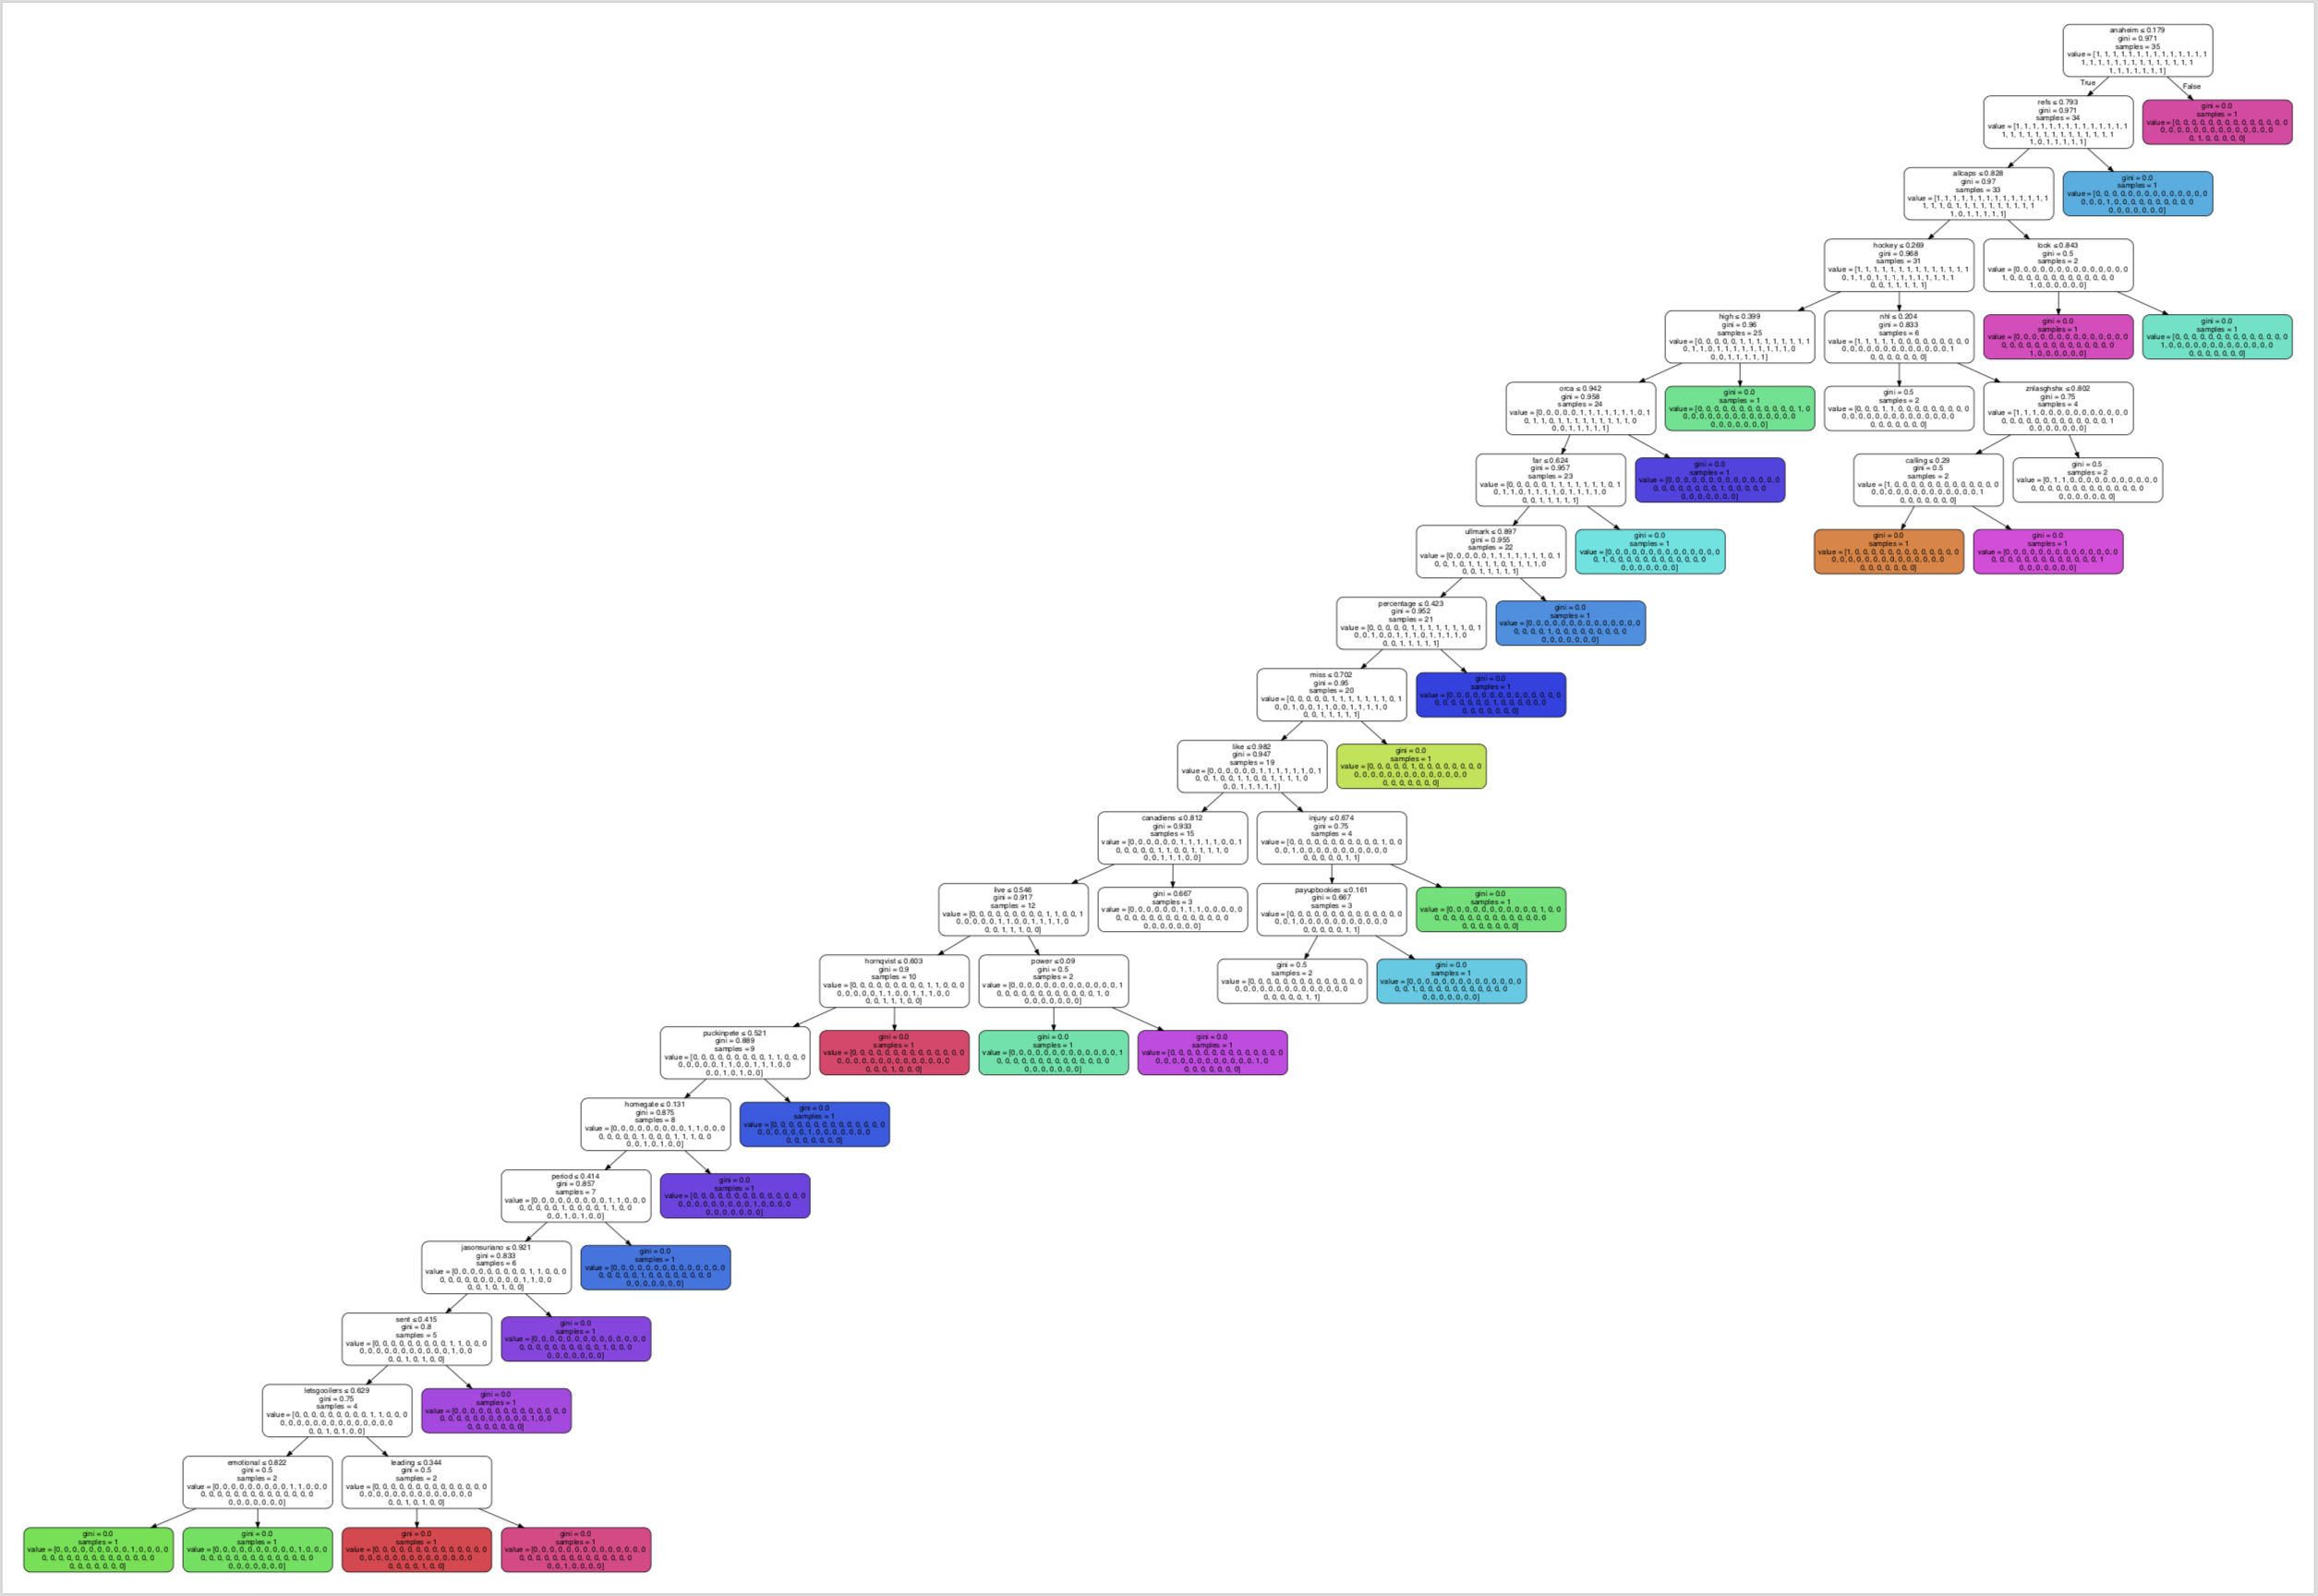
Figure 2. Decision Tree 2 This tree had a root node of Anaheim witht he root node being pure. The decsion tree followed a trend with many nodes being pure throughout the length of the tree. The tree also appears to have a larger depth compared to the previous tree. The tree looked at the GINI and also was split randomly which selects a feature randomly compared to best which takes the feature with the highest importance. Words focused on observations about games such as percentage and missed which were linked in the tree. Click on the image to see the pdf file of the image.
Table 2. Confusion Matrix of Decision Tree 2 A confusion matrix was created for decision tree two with a zero percent accuracy. The results show that it was not effective most likely due to the random nature of tweets.
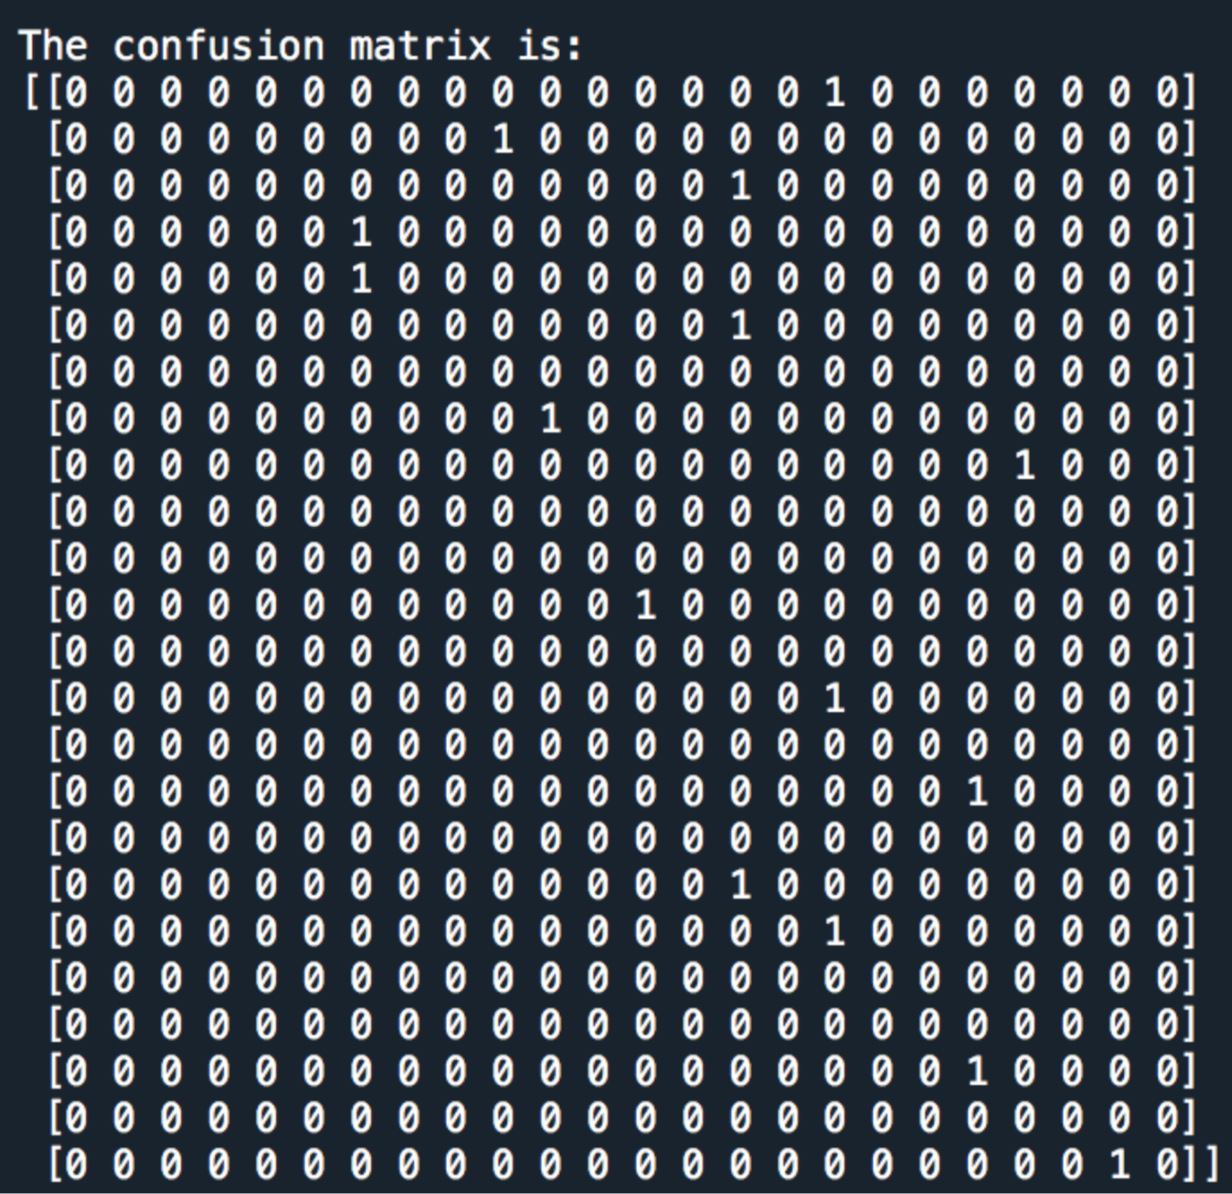
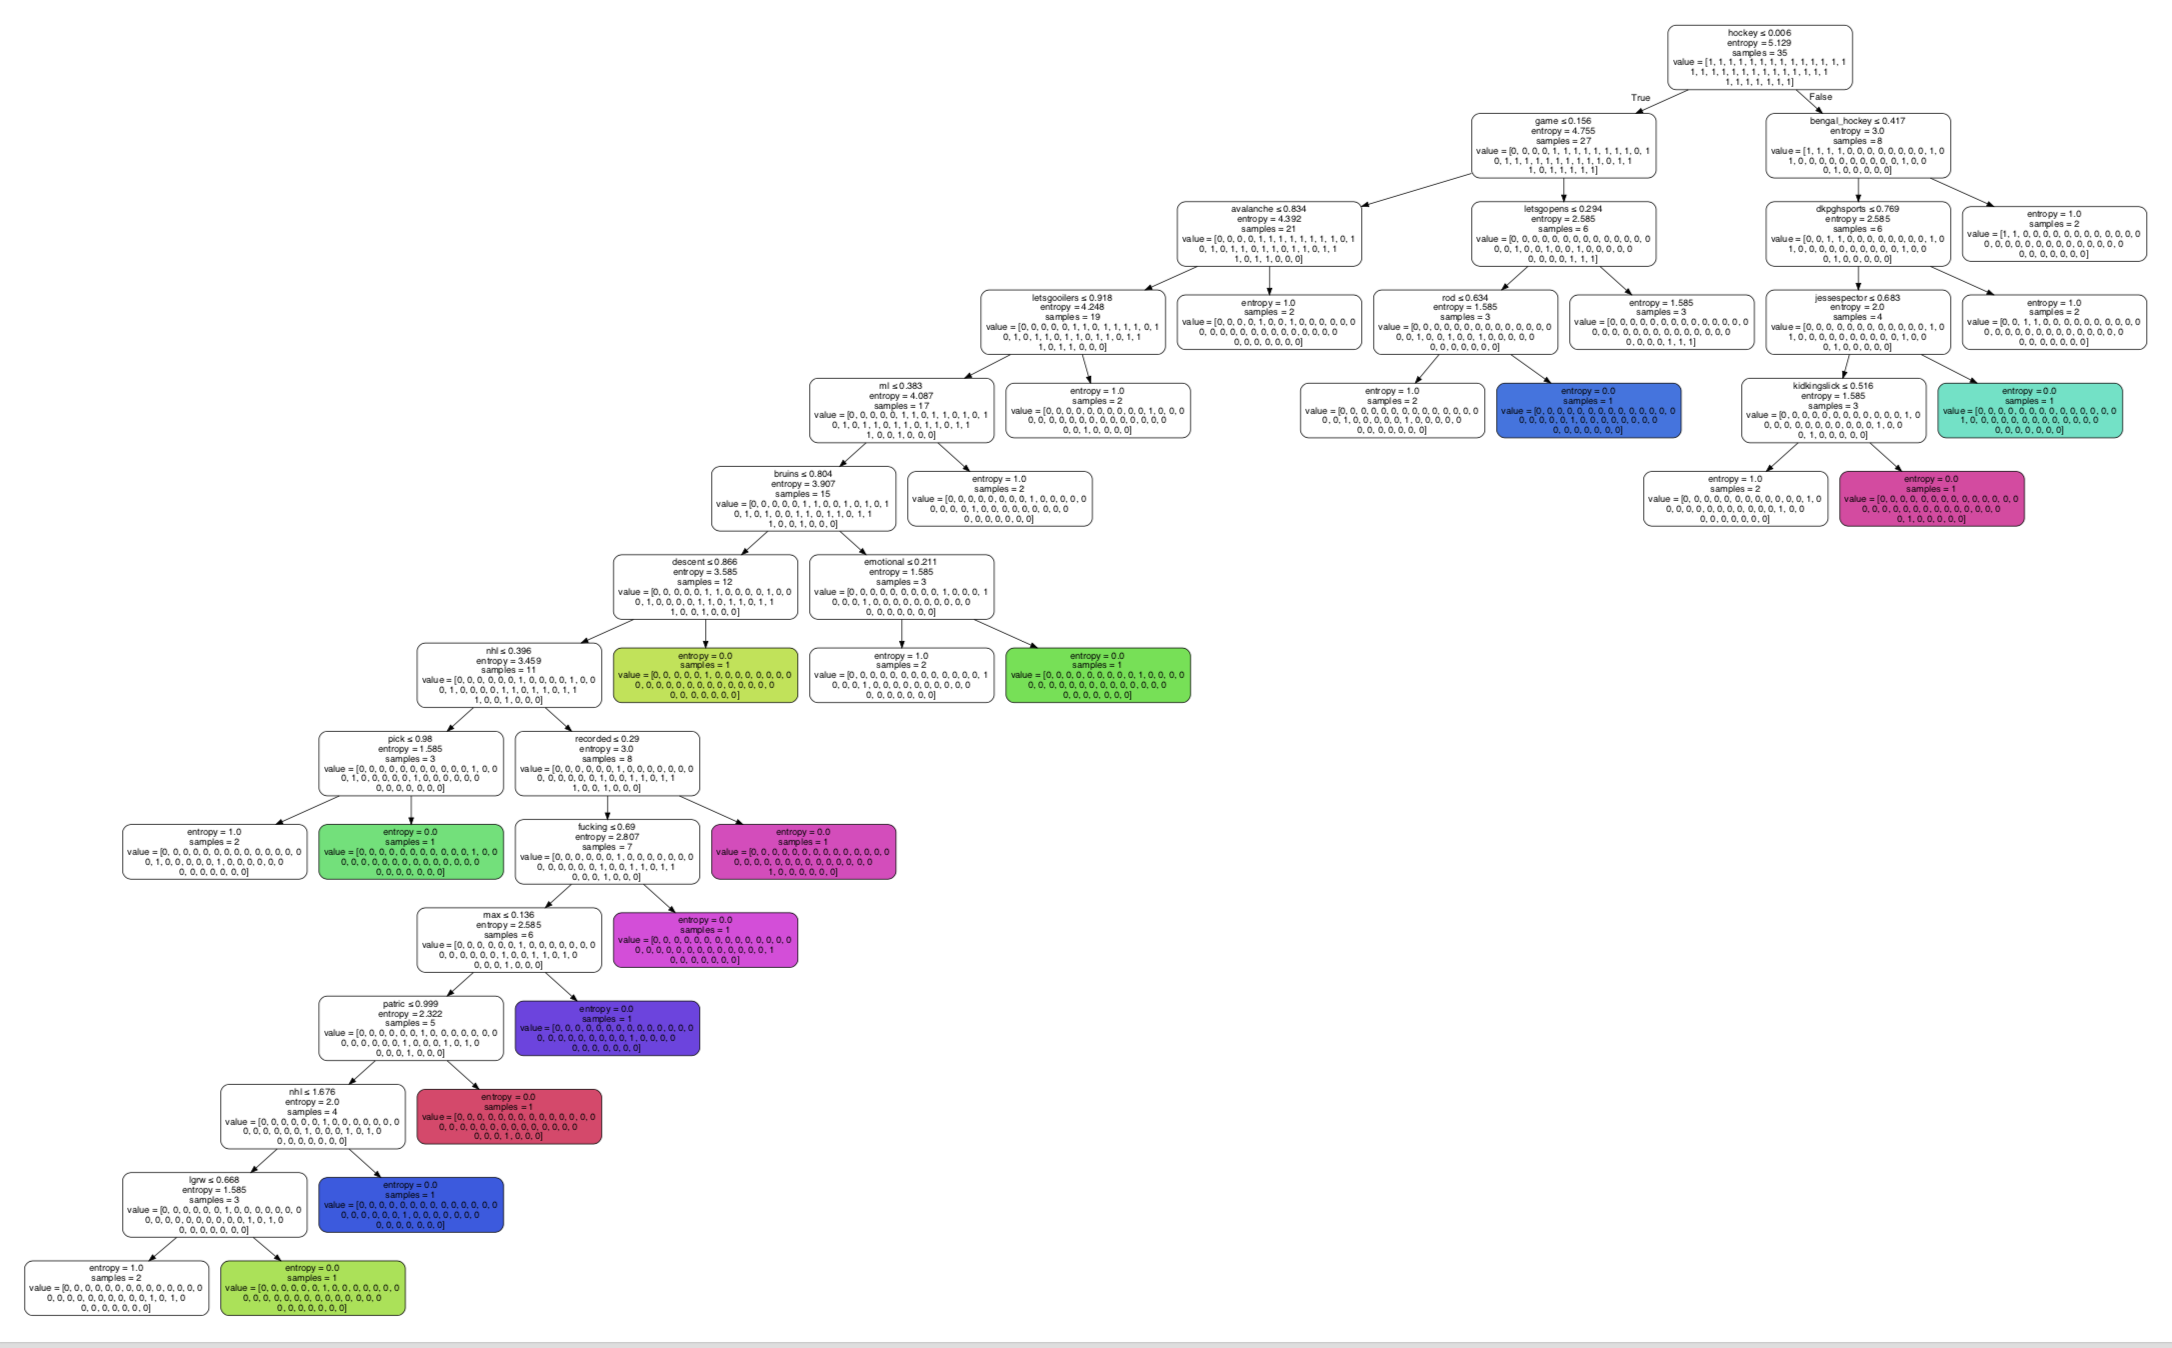
Figure 3. Decision Tree 3 The third tree had a root node of hockey where it split in two different directions. In one direction it went brings up words associated with smaller non-nhl teams, while in the other direction it discusses NHL teams and their games. This tree is similar to the first tree because teamnames are associated with other team names. The tree was split randomly and then looked at the entropy of the nodes. This tree had similar depth compared to the first tree but less then the second. Additionally it had less pure nodes compared to the second tree. Click on the image to see the pdf file of the image.
Table 3. Confusion Matrix of Decision Tree 3 A confusion matrix was created for decision tree three with a 0% accuracy. The results show that it was not effective most likely due to the random nature of tweets.
The decision trees had a trend of associated words about teams with each other and associated words that are about watching the game together in all three trees. The model was not a great predicter and this might be due to the nature of the randomness of tweets.