Decision Tree of Record Data in R
Link to Code

Link to Data Set
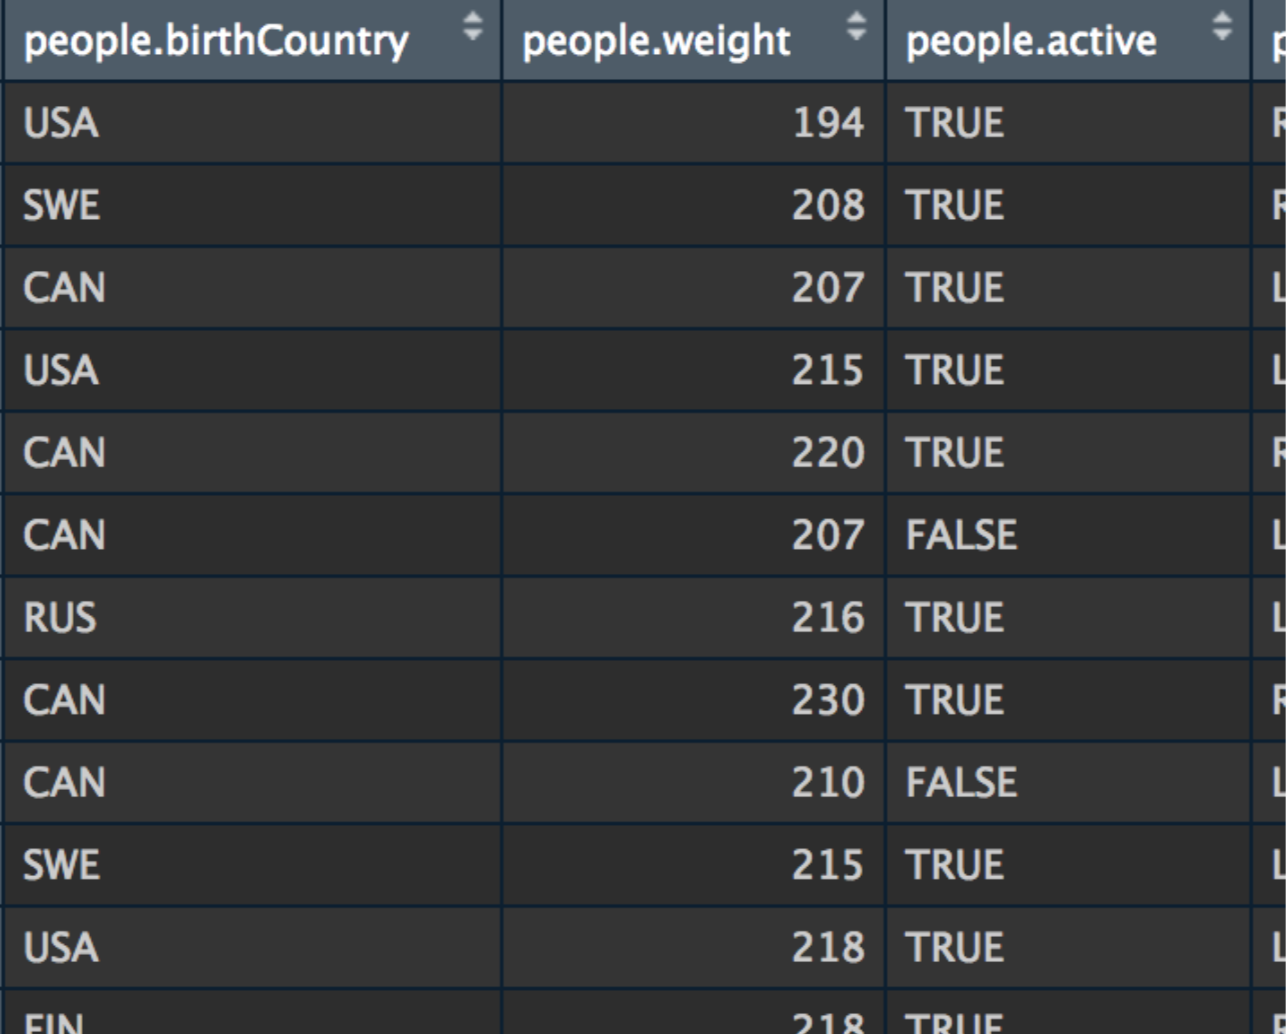
Decision Trees
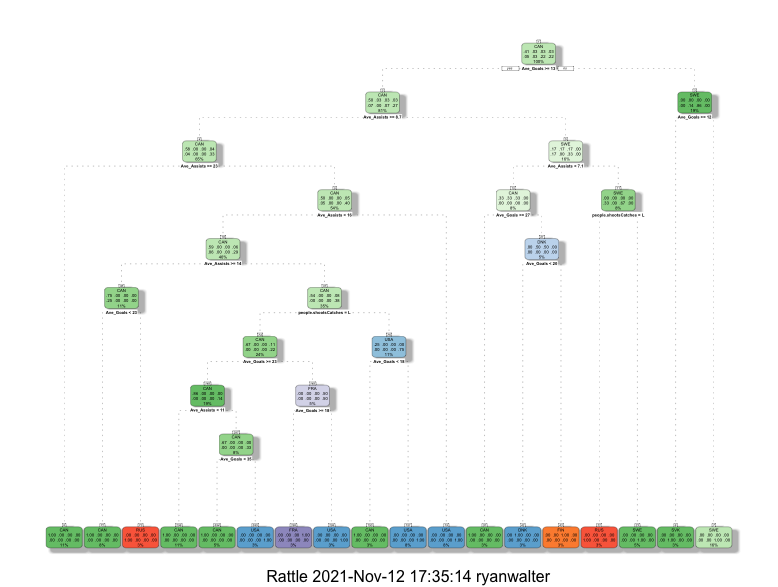
Figure 1. Decision Tree 1 The key features of this decision tree center on Average Goals, Average Assists and if they are righty or lefty with the root node being Average Goals and the class being which country the players are from. By splitting the nodes by information and setting the minsplit to 2, it produced a better tree. The tree showed that Canadians scored the most goals compared to other countries. Click on the image to see the pdf file of the image.
Table 1. Confusion Matrix of Decision Tree 1 A confusion matrix was created for decision tree one with an accuracy of 15%. The results show that it was more successful in predicting for the country of Canada but also confused Canada and the US multiple times.
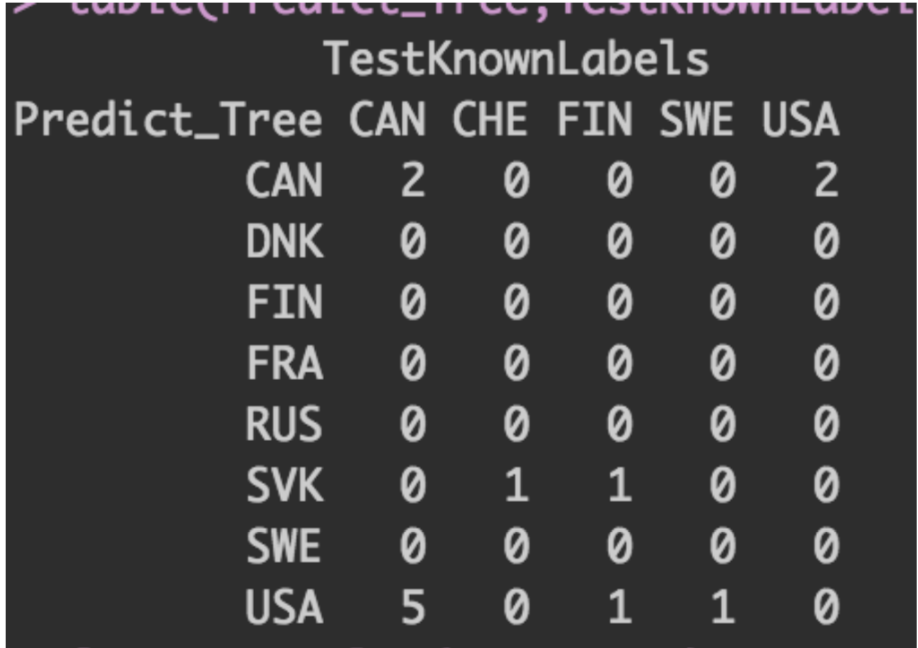
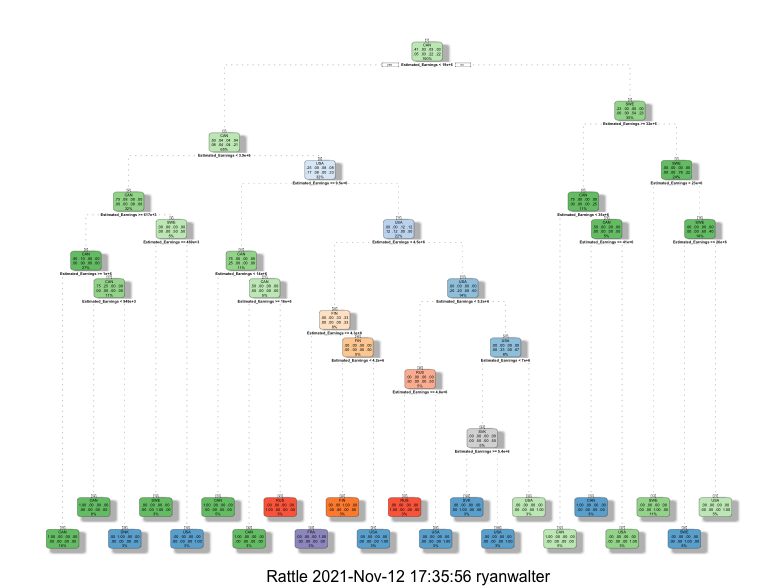
Figure 2. Decision Tree 2 The key features of this decision tree center on estimated salary for each country the players are from. By splitting the nodes by information and setting the minsplit to 2, it produced a better tree. This tree showed that there were more people from countries other than Canada who had higher estimated earnings. This might be because there is a higher percentage of Canadians in the NHL and thus there is a more likely chance of them being payed less than the foreign players because foreign players need to be the best of their respected country to play in the NHL. Click on the image to see the pdf file of the image.
Table 2. Confusion Matrix of Decision Tree 2 A confusion matrix was created for decision tree two shows an accuracy of 23%. The results show that it was more successful in predicting for the country of Canada, additionally European players would most likely be matched with other European countries.
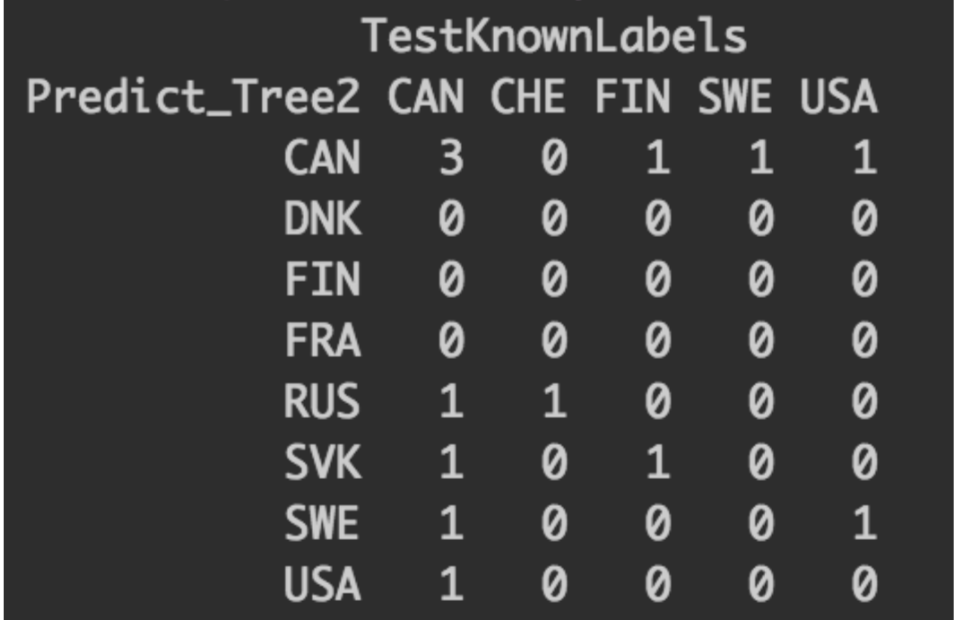
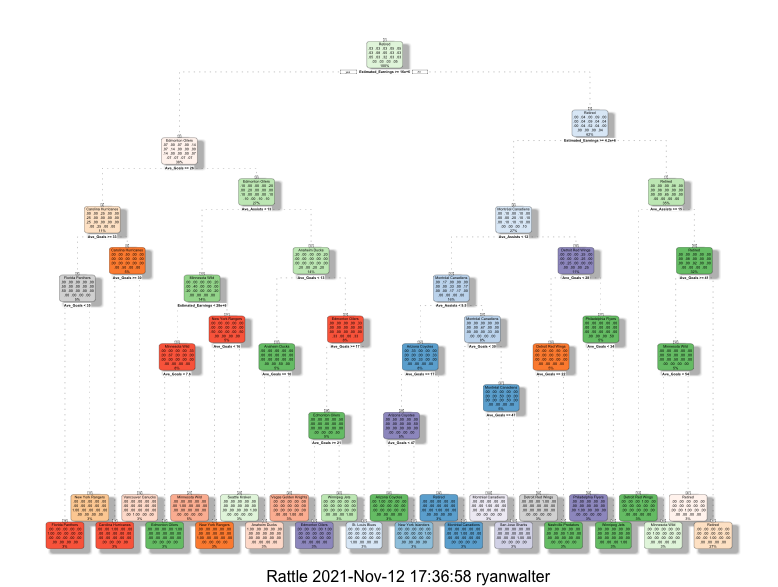
Figure 3. Decision Tree 3 The key features of this decision tree center on average goals, average assists and estimated salary for each team the players are on with the root node being estimated earnings. By splitting the nodes by information and setting the minsplit to 2, it produced a better tree. The tree showed that players in larger cities such as New York, Las Vegas and Seattle have higher estimated earnings then those is smaller city teams. This might indicate hat larger cities might have more leeway to spend money close to the cap limit compared to smaller city teams due to the higher potential fan base supporting this higher spending. Click on the image to see the pdf file of the image.
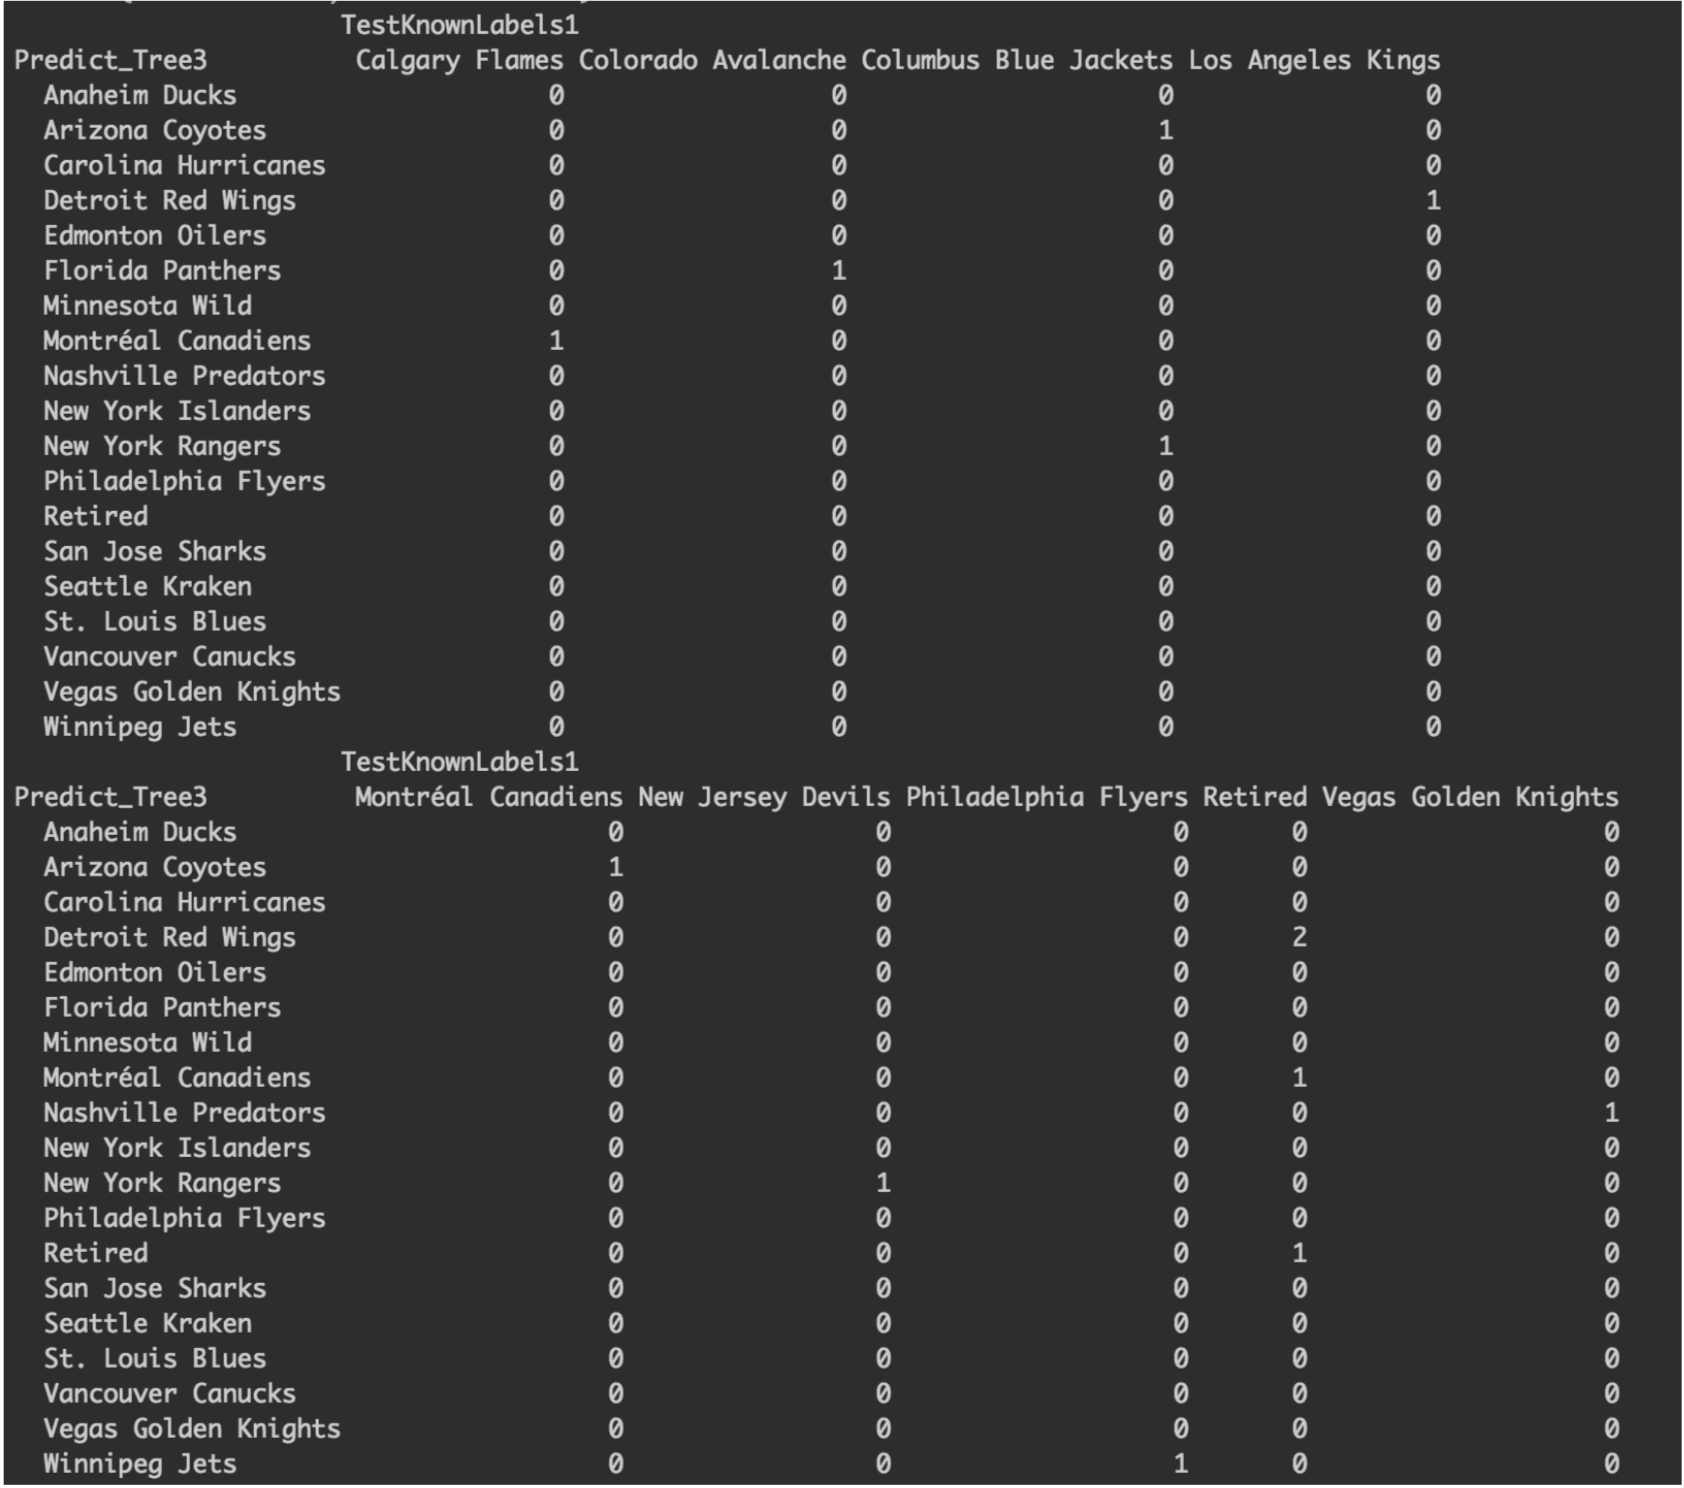
Table 3. Confusion Matrix of Decision Tree 3 A confusion matrix was created for decision tree three with an accuracy of 8%. The results were not accurate for the model and this might be due to the large number of teams with very little separating each team. This would not allow for an accurate model with the limited data available.
The decision trees show that Canadians have a stronger presence in the league and dominate the stats such as goals and salary except for a few high payed international players. NHL teams have little to differentiate themselves by in terms of goals and assists but larger cities appear more likely to pay a higher estimated salary based off of their players earnings.