Text Data Clustering Using Python
The Twitter Data from Hashtags #NHL, #NHLNews, #NHLFantasy were analyzed in Python using different clustering methods.
Link to the Code
Link to Dataset
Word CLoud of Data

The Twitter Data from Hashtags #NHL, #NHLNews, #NHLFantasy were analyzed in Python using different clustering methods.


the elbow method and the silhouette method were applied to the data to determine the correct number of clusters.
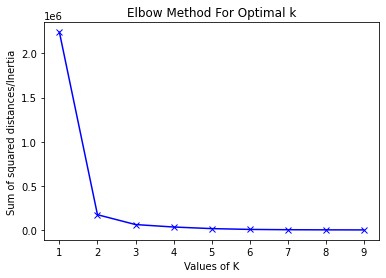
The Elbow Method is a method in which the explained variation is plotted as a function of the number of clusters. It gets its name of the elbow methid because the number of clusters is chosen by looking at the "elbow" of the graph. As seen above, the graph shows that the correct number of clustes for this data is 2.
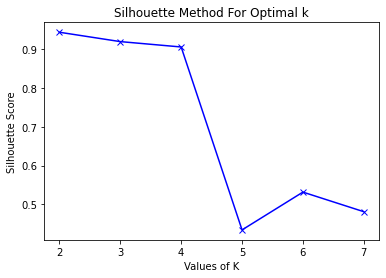
The silhouette method measures how similar an object is to its own and other clusters and then the results are plotted.
The closer it is to one, then the more accurate the number of clusters.
As seen above the graph shows that the number is 2 clusters which confirms the results of the elbow method.
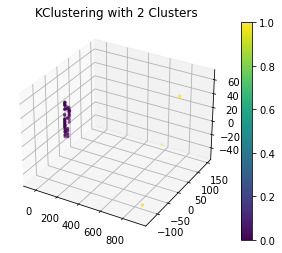
Next the kmeans is calculated from the number of clusters chosen by the elbow and silhouette method, and then plotted as seen above.
PCA was used to plot due to the high dimensionality of the data, which projects the original data into a reduced space using eigenvectors of the covariance matrix.
This allows for a plot to be formed from high dimensional data as seen above.
The two clusters show a trend where majority are in one cluster while the other has a few points which does not coincide with the predictions.
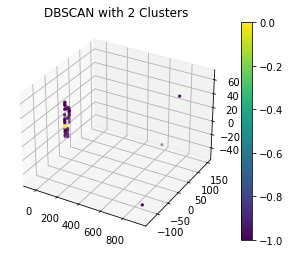
DBscan was applied to data set and plotted above. DBscan is a method that ignores noise while searching for high density clusters of points and expanding from those.
Using this method produced similar results to the kmeans clustering in which majority of the data was in one cluster.
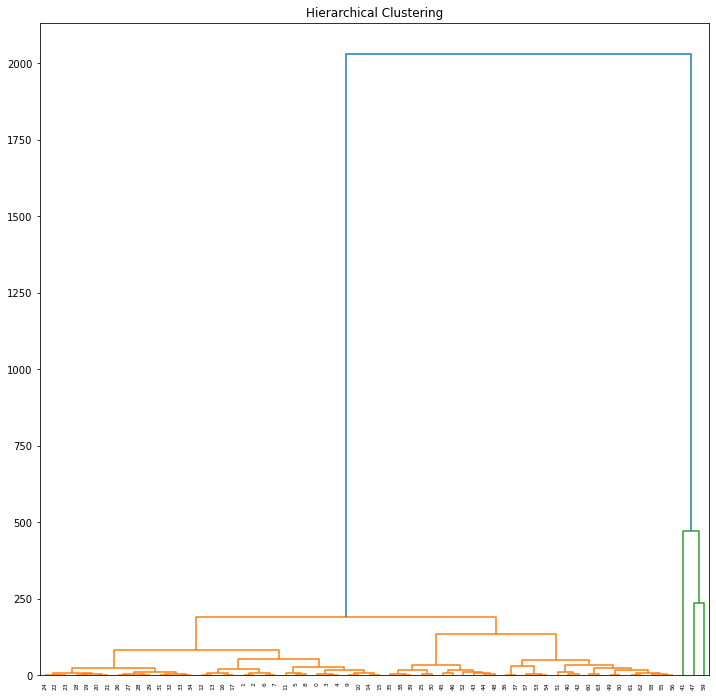
The data set was clustered using hierarchical clustering employing the euclidean method and then plotted using a dendrogram as seen above.
The results show that majority of the tweets belong to one cluster which is consistent with the other clustering methods.
After clustering, the results showed that majority of the tweets bellonged to one cluster which was against what was predicted. Since the tweets were gathered using three different hastags and with the same numbers for each hastag, we predicted that there would be three clusters with three distributions. Reasons why this might be the case is bnecause using only one hastag is not specific enough to form trends in the tweets, thus giving our results. New methods of collection will be examined after these results.