Record Data Clustering Using R
The 2011 Biographical, Game, and Salary Stats were combined and analyzed in R using different clustering methods.
Link to the Code
Link to Dataset
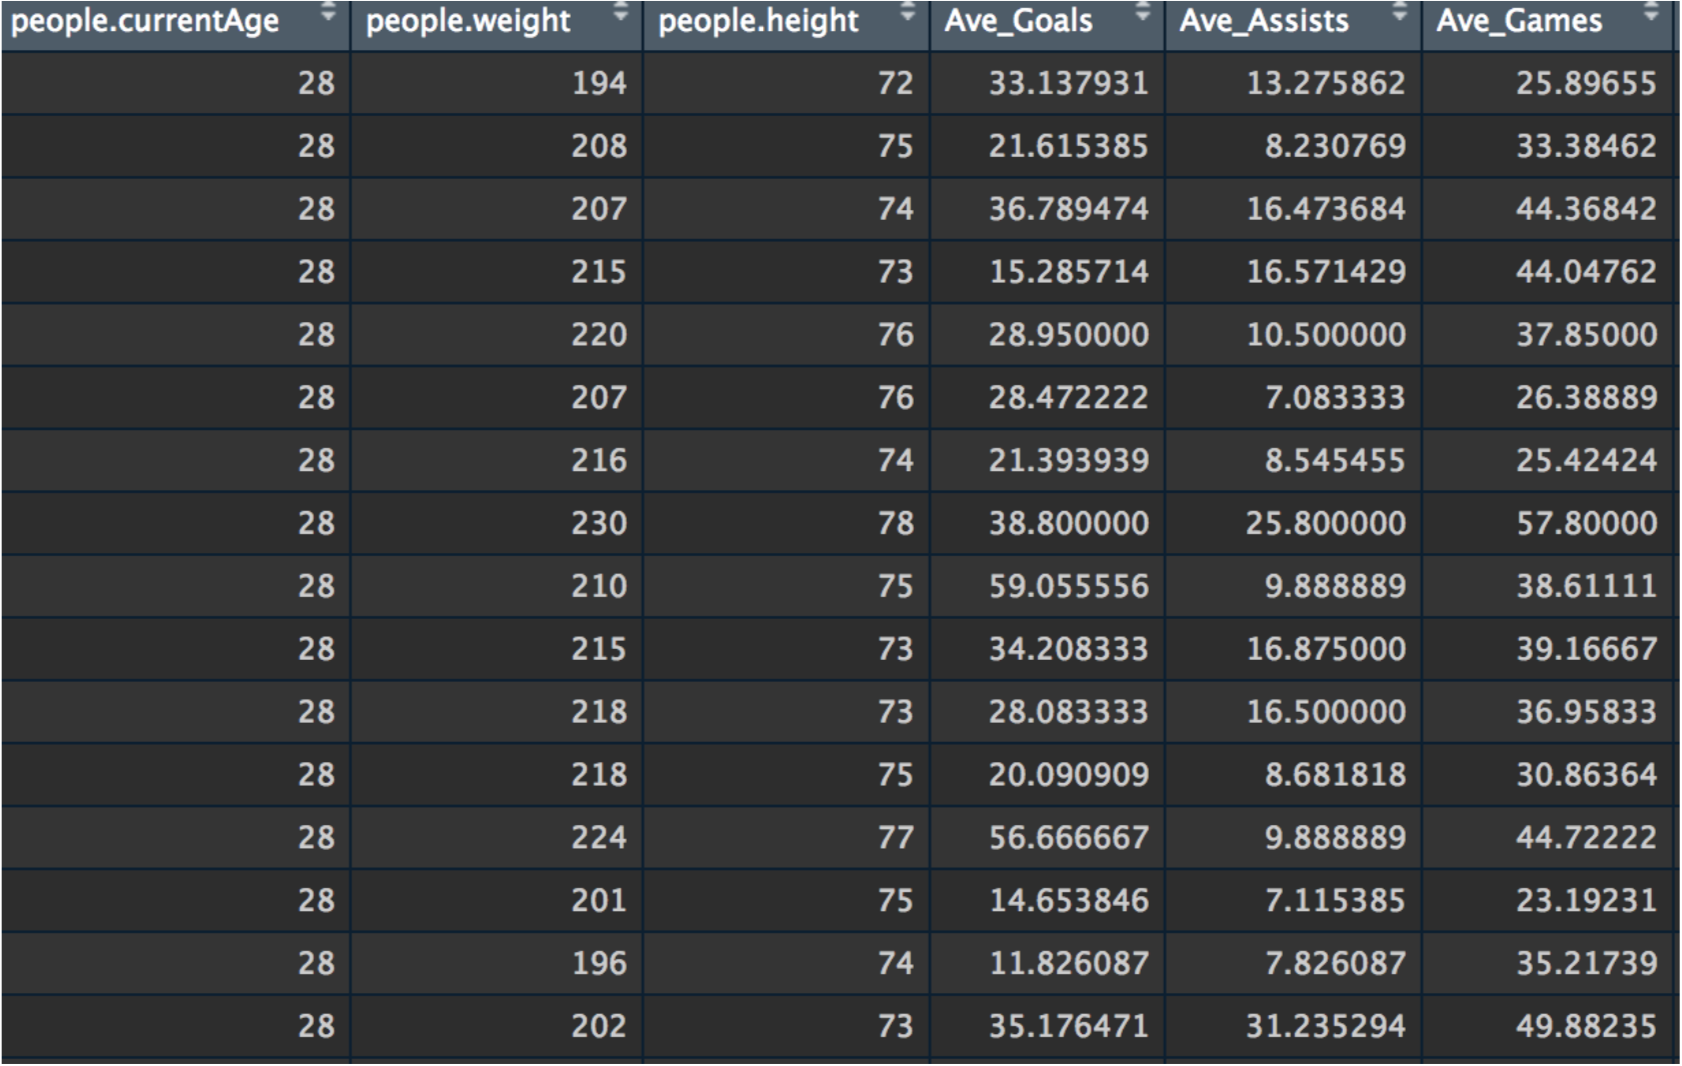
The 2011 Biographical, Game, and Salary Stats were combined and analyzed in R using different clustering methods.


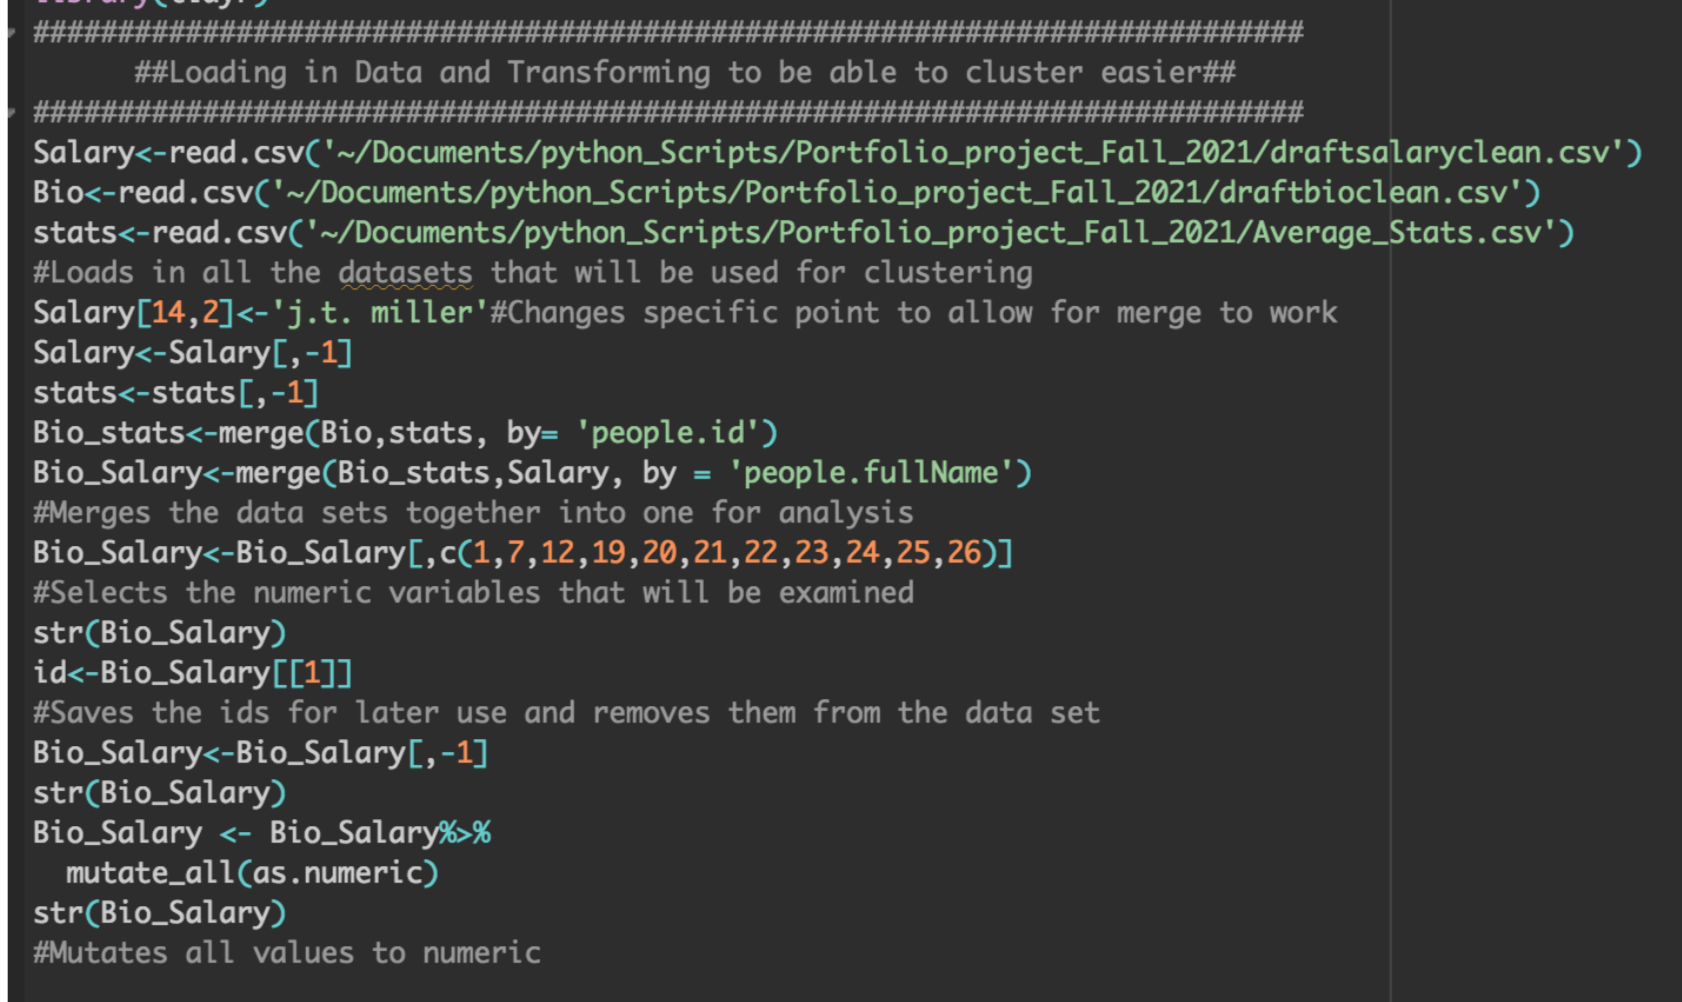
The Biographical, Game, and Salary Record Data were loaded into R using read.csv. They then were merged based off of people.id and people.fullName to make one single data set.
Nonnumeric rows were then removed and the id such as names were removed to allow for clustering later on as seen above.
Distance Matrices were taken of the dataset to give a better understanding of the relatedness of each player with one another which gives a rough understanidng in regards to clustering.
The four methods used were Minkowski, Euclidean, Manhattan, and Cosine Similarity.
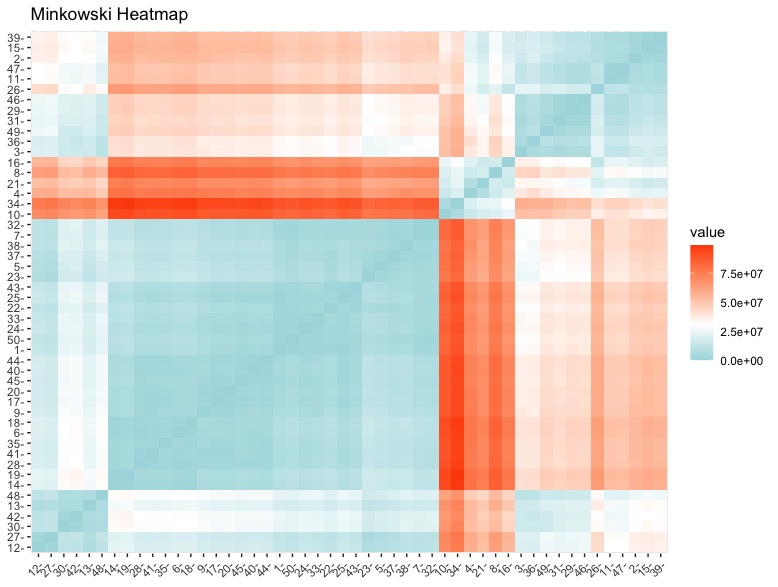
The Minkowski Distance Matrix takes the similarity/distance between each of the rows and is a generalization of the Euclidean and Manhattan Distance formula.
The results are shown in a heat map above.
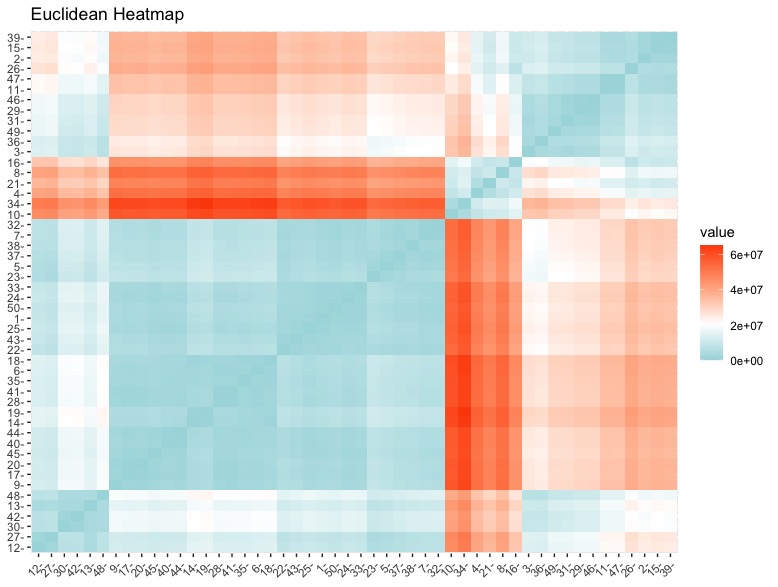
The Euclidean Distance Matrix takes the distance between the rows by takling the line segment in euclidean space between them. the results are shown in a heatmap above.
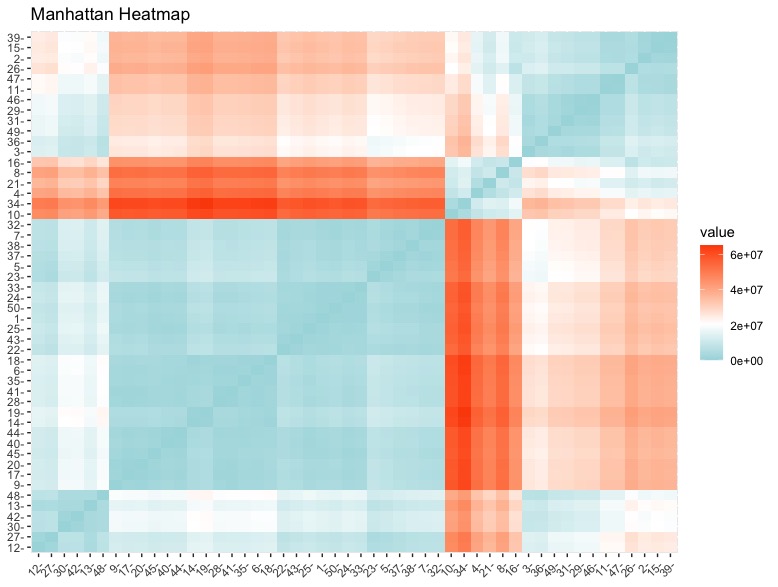
The Manhattan Distance Matrix takes the distance between the rows by measuring the lenghts of the projections of the line segments between the points. The results are plotted above.
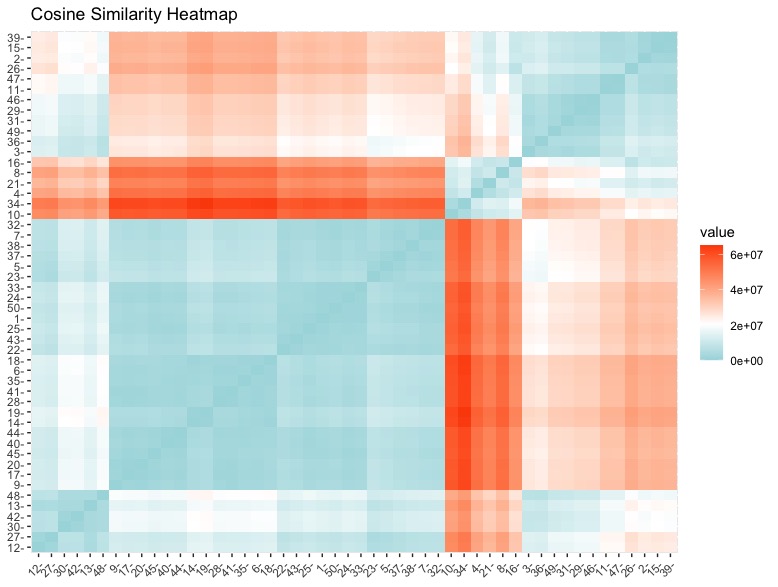
Cosine Similarity Matrix measures the distance between the rows by examining the cosine of the angle between them. The results are plotted above.
Kmeans Clustering was applied to multiple different subsets of the data.
A subset of the data set was taken which contained the variables Height and Earnings
Next the elbow method and the silhouette method were applied to the data to determine the correct number of clusters.
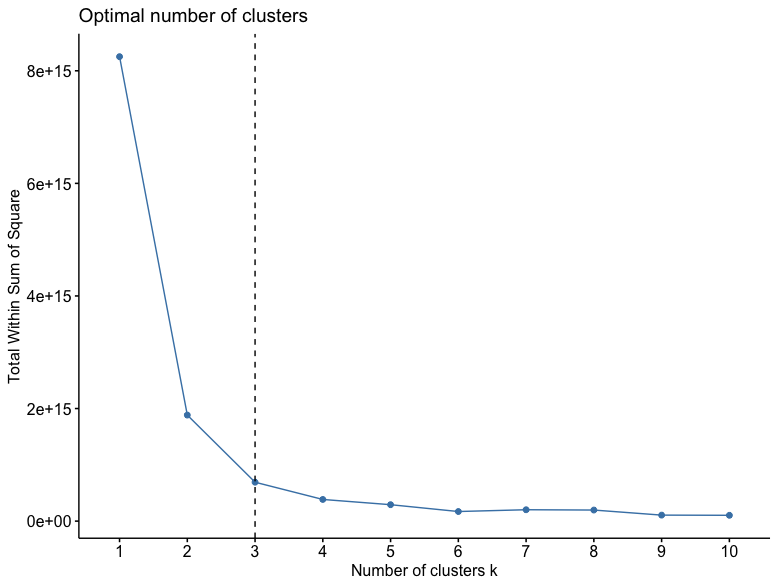
The Elbow Method is a method in which the explained variation is plotted as a function of the number of clusters. It gets its name of the elbow methid because the number of clusters is chosen by looking at the "elbow" of the graph. As seen above, the graph shows that the correct number of clustes for this data is 3
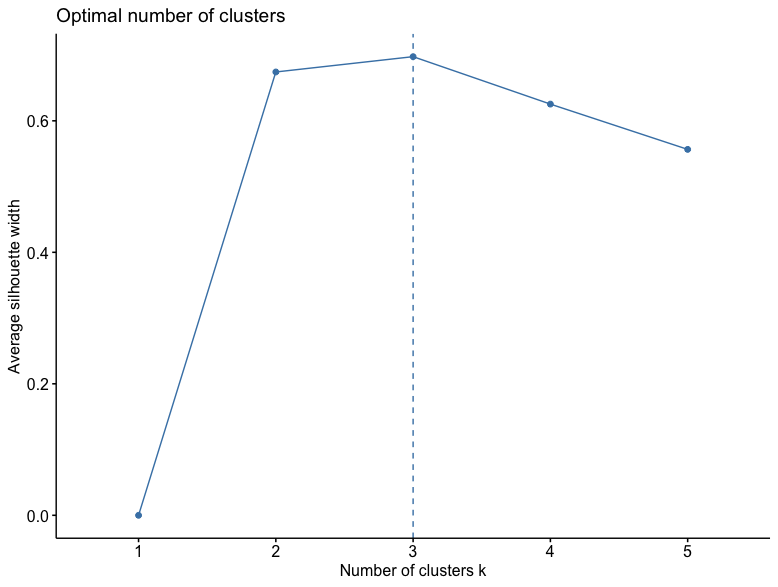
The silhouette method measures how similar an object is to its own and other clusters and then the results are plotted.
The closer it is to one, then the more accurate the number of clusters.
As seen above the graph shows that the number is 3 clusters which confirms the results of the elbow method.
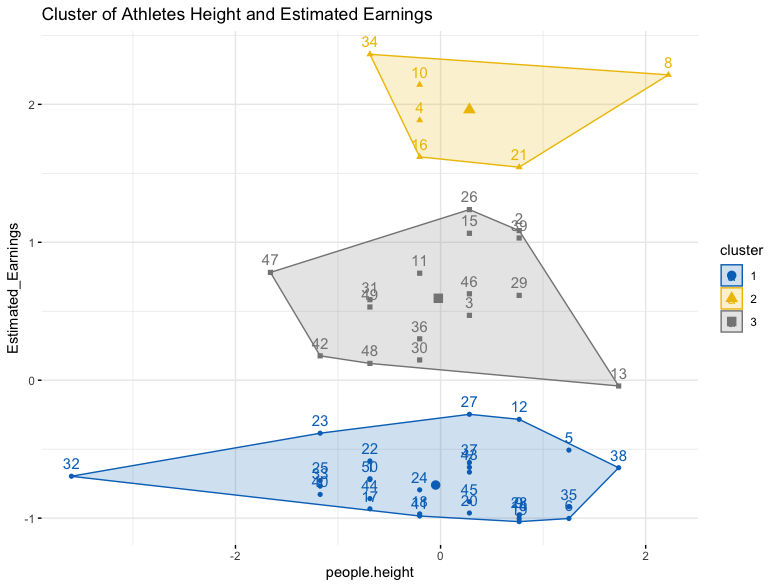
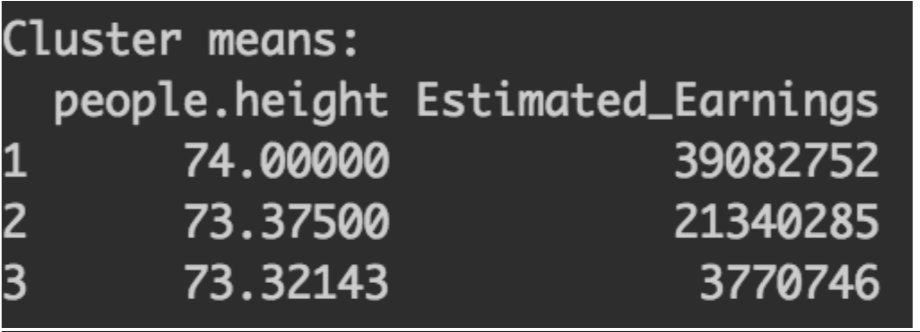
Next the kmeans is calculated from the number of clusters chosen by the elbow and silhouette method, and then plotted as seen above.
These three clusters show a trend in which the taller you are then the more your estimated earnings are.
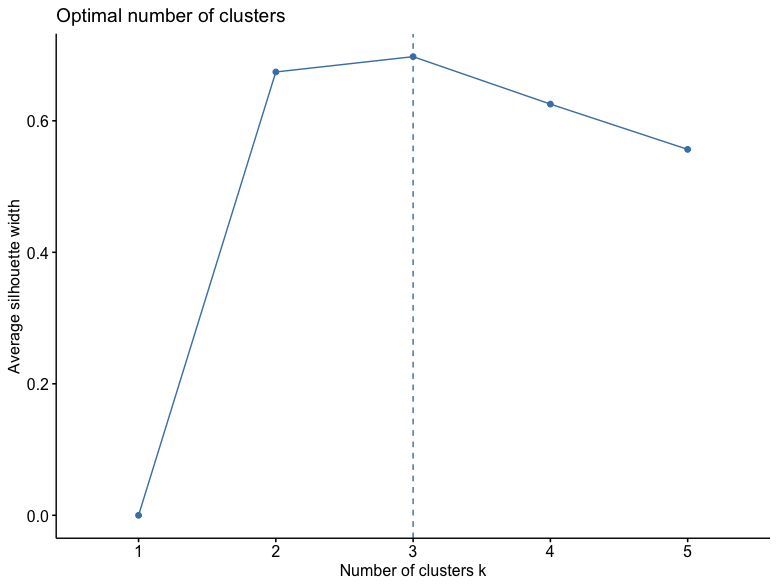
The silhouette method was used and the number of clusters is 3 as seen above.
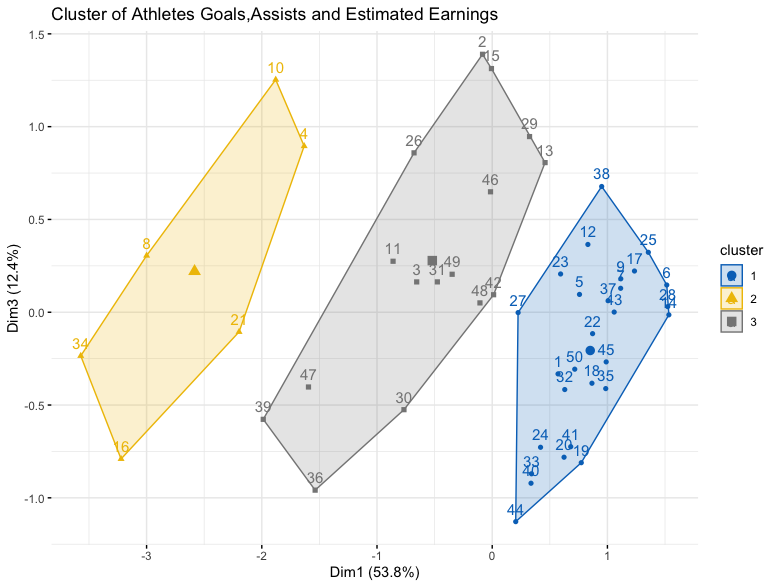
The results of the kmeans show that it is a combination of goals and assists not just goals alone that lead to high estimated earnings as seen above.

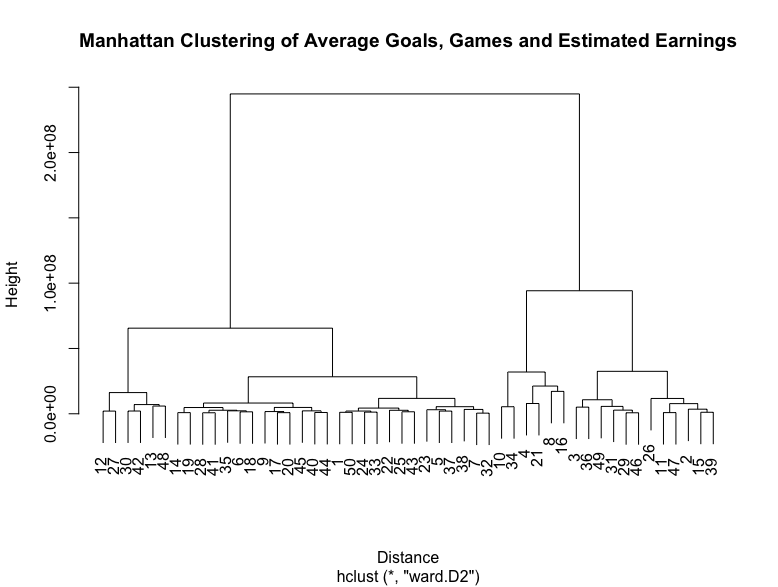
A subset of average games, goals and estimated earnings was created.
This subset was then clustered using hierarchical clustering using the manhattan method and then plotted using a dendrogram.
The results suggest that there are 3-4 clusters with more games, goals and earnings clustered together which confirm the hypothesis.
After clustering the results confirmed many of our predictions. The first is that the bigger a player is, the more they will be payed.
Additionally, the more goals and assists a player has the higher their estimated salary is.
Additionally, the number of clusters were consistent with the number of clusters being three.
However one trend that we found which was interesting was that the highest payed had a combination of goals and assissts not just goals.
This suggests that team players who set their teammates up are just as important and will be payed higher then those who just score.
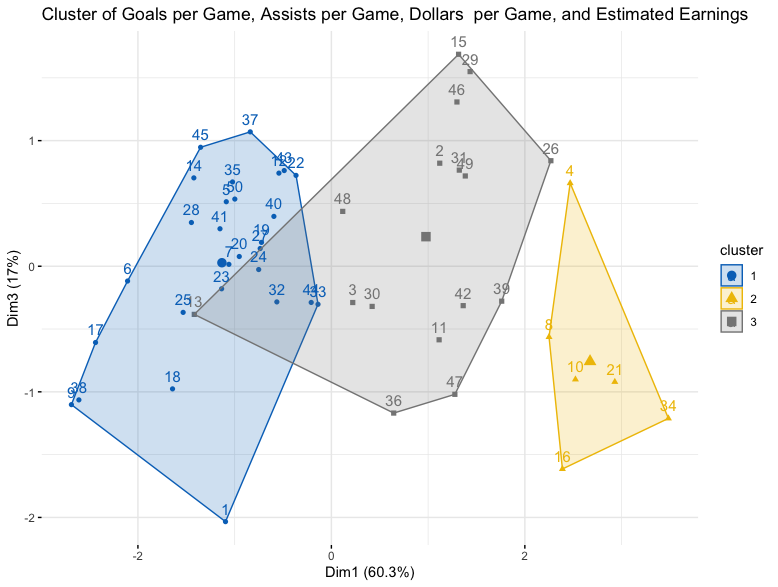
Three new variables were created, average goal per games, assist per game, and estimated earnings per game.
These then were analyzed using he silhouette method and found that 3 clusters was the ideal number of clusters.
The number of clusters were then plottend after taking the kmeans as seen above.
The results showed that they were clustered based on similar stats with a higher combination of assists and goals per game led to higher estimated earnings and earnings per game.